Analysis detail
The analysis detail is where you build an analysis. An analysis is made of one or more table blocks, and each block is a table you configure on its own: you choose where its data comes from, how the results are broken down, and which extra statistics to show. You open this view from the Analysis list: open the … menu on an analysis row and choose View.
Header
Section titled “Header”The header stays at the top of the view while you work.
- Back — returns to the analysis list.
- The analysis title, with a pencil icon next to it. Select the pencil to rename the analysis.
- Below the title, the source survey name and its launch date (for example, Customer Satisfaction Survey - Launched on 6/16/26).
- Export data — at the top right, exports the analysis data.
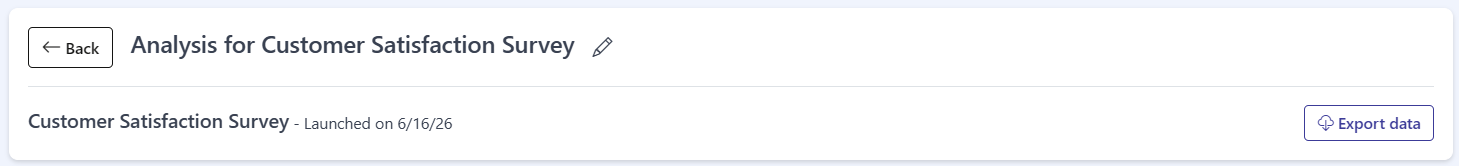
Table blocks
Section titled “Table blocks”An analysis is built from one or more table blocks. Each block has its own title with a pencil icon to rename it (for example, Numeric scale questions result), and a row of actions:
- Clone — duplicate the block.
- Up — move the block up.
- Down — move the block down.
- Delete — remove the block.

Configuring a table
Section titled “Configuring a table”Each table block has its own settings. Set them in this order to choose what the table shows.
Get data from
Section titled “Get data from”Get data from chooses the data source for the table. Open the dropdown to pick one:
- Numeric scale questions
- Participation
- NPS questions
- Sentiment analysis (text questions)
- Choice questions (first option)
- Choice questions (second option)
Below it, a second dropdown narrows the scope of that source (for example, All questions result).

See results by
Section titled “See results by”See results by chooses how the results are grouped and broken down. Open the dropdown to pick one:
- Age
- Manager (direct hierarchy)
- Manager (full hierarchy)
- Questions
- Start date
Next to it, … and segment also by lets you cross-segment the results by a second dimension. Combine the two dropdowns to build a cross-tabulation: the choice in See results by sets the main breakdown, and the choice in … and segment also by splits each group further.

The Data row has four toggles. Each one adds an extra statistic or column to the table:
- Show standard deviation
- Show confidence
- Show sample size
- Show heatmap
Turn on the ones you want. Leave them off to keep the table simple.

Results table
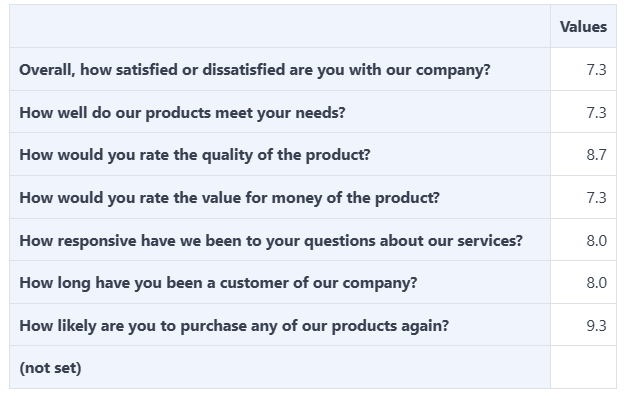
Section titled “Results table”The results table shows the data for your settings. The rows are the questions (or whatever you chose in See results by), and the Values column shows the computed value for each row (for example, 7.3 or 8.7).
A (not set) row can appear for responses that have no value for the chosen grouping.
Adding a table
Section titled “Adding a table”To add another table block to the analysis, select Add table at the bottom of the view. The new block appears below the existing ones, ready for you to configure.

Frequently asked questions
How do I open the analysis detail?
From the Analysis list, open the ... menu on an analysis row and choose View.
What is a table block?
A table block is one configurable table inside an analysis. You choose its data source with Get data from, how to break it down with See results by, and which extra statistics to show in the Data row.
How do I cross-reference two dimensions?
Pick one dimension in See results by and a second in ... and segment also by. Combining them builds a cross-tabulation.
Can an analysis have more than one table?
Yes. Select Add table at the bottom to add another table block.